> ## Documentation Index
> Fetch the complete documentation index at: https://lightdash-mintlify-bd2f482e.mintlify.site/llms.txt
> Use this file to discover all available pages before exploring further.
# Canvas
> Use the Canvas view to visualize metric relationships, hierarchies, and dependencies in a flexible workspace.
The **Canvas View** is a flexible workspace for visualizing and organizing metrics. You can use it to build **Saved Trees** that show how metrics relate to each other, visualize hierarchies, and understand dependencies across your data model.
### How to use the Canvas view
1. **Open the Canvas view**: Switch to the Canvas view toggle in the metrics catalog. The left rail lists every Saved Tree in the project.
2. **Open or create a tree**: Click an existing tree to open it, or click **New Tree** to start a fresh one (which puts you in edit mode).
3. **Filter your metrics** *(edit mode)*: Use the search bar, categories, or table filters to narrow down the sidebar. Categories help you group and label related metrics, making it easier to find what you need. Need help creating categories? [Learn more here](/guides/metrics-catalog/catalog#browsing-the-catalog).
4. **Add metrics**: Drag metrics from the sidebar into the canvas workspace. Click **Load more** at the bottom of the sidebar to pull additional metrics from the catalog.
5. **Create connections**: Drag between node handles to draw edges representing relationships and dependencies.
6. **Remove nodes**: Select a node and press **Backspace** to delete it.
Viewers can see trees and connections but cannot make edits.
## Saved Trees
Saved Trees are named, persistent canvas layouts that preserve your metric arrangements and connections. They store the full layout — every node position and every edge — so you can return to the same view next session and share the link with teammates.
Saved Trees are shared across your team: anyone with access to the project can view them, and users with the right permissions can create, edit, and delete them.
### Creating a Saved Tree
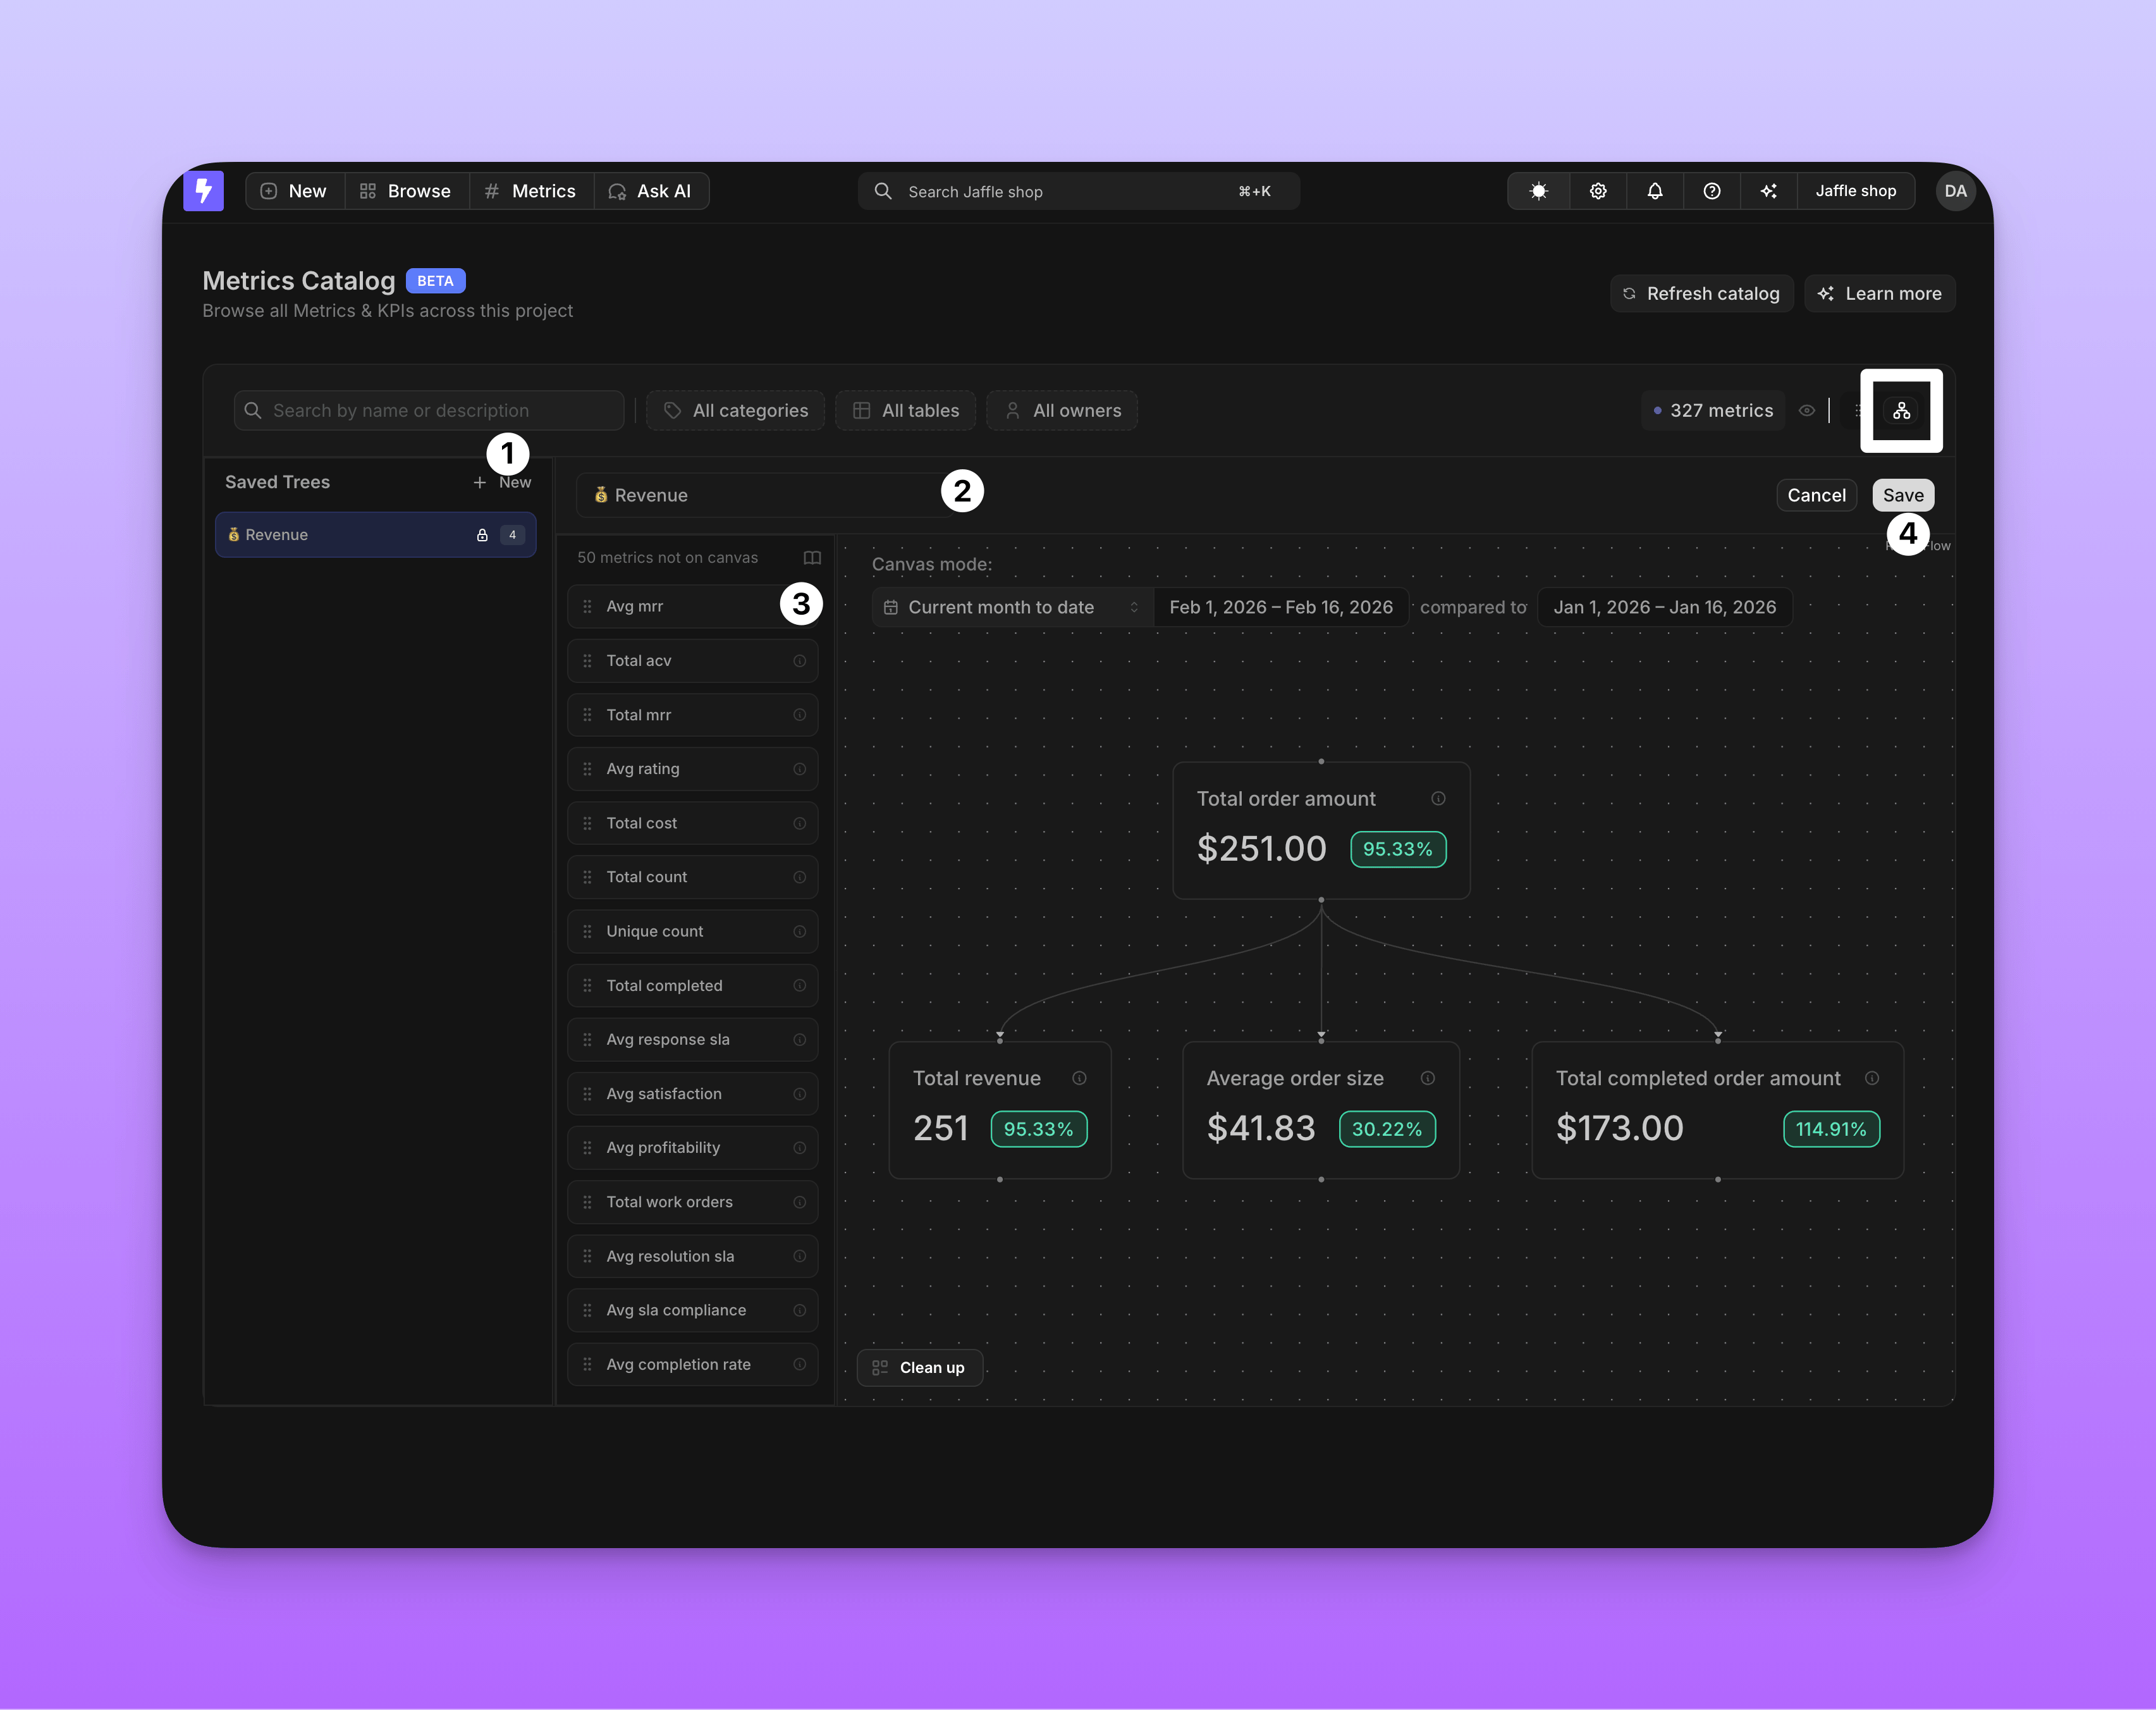
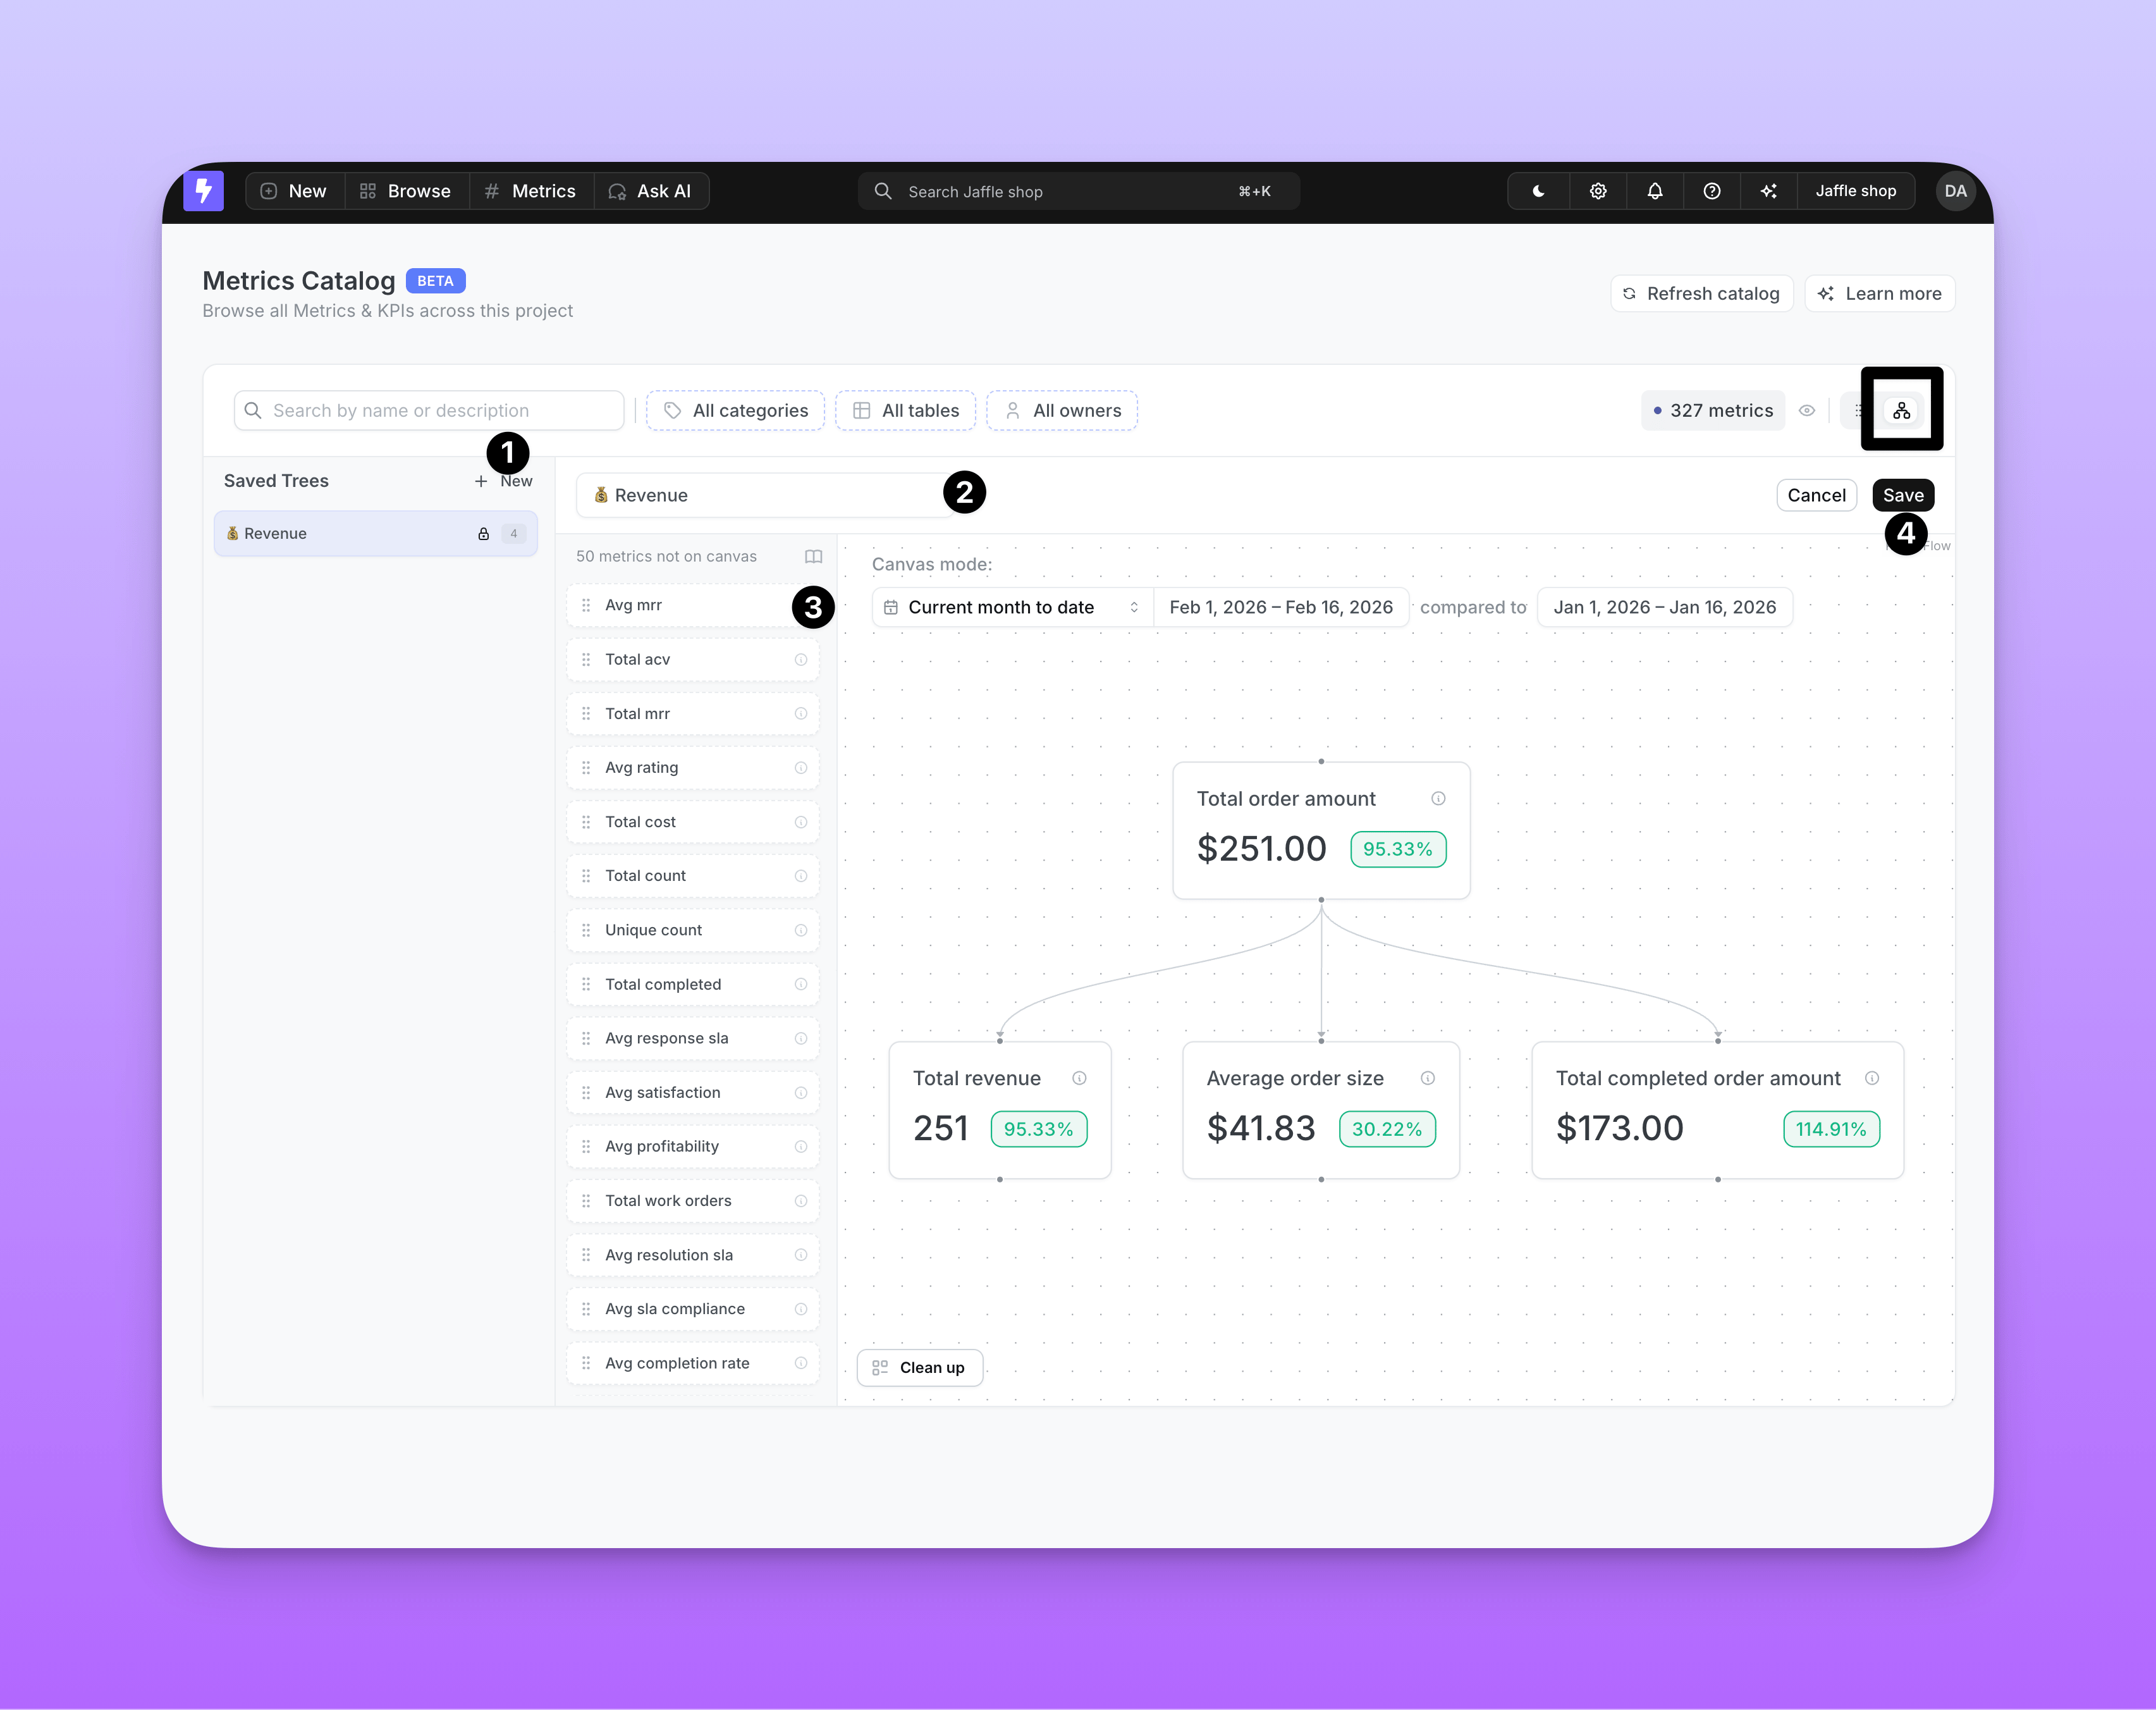 1. In the Canvas View, click **New Tree** to enter edit mode.
2. Type a name in the text input at the top of the canvas.
3. Drag metrics from the sidebar into the canvas and draw connections between them.
4. Click **Save**. The button is disabled until you provide a name and add at least one node.
When you save, the tree name, node positions, edges, and metric references are all persisted.
Click **Cancel** to discard your work. If you have unsaved changes, a confirmation dialog will appear.
[Driver edges](#drivers) are not stored with the tree — they are injected automatically whenever matching nodes are present.
### Collaborative locking
Only one user can edit a Saved Tree at a time. When you start editing, the tree is locked to you. The lock stays active while you work — if you stop editing for more than 2 minutes, the lock is automatically released so others can make changes.
When a tree is locked by another user, you'll see an **"Editing by "** badge in the header, and the Edit and Delete options are disabled until the lock is released.
Your changes are automatically saved as a draft while you edit, so if you accidentally close the tab or refresh the page, your work-in-progress can be recovered when you return.
### Permissions
| Action | Admin | Developer | Editor | Interactive Viewer | Viewer |
| :------------------ | :-------------------------------------------: | :-------------------------------------------: | :-------------------------------------------: | :-------------------------------------------: | :-------------------------------------------: |
| View a Saved Tree | | | | | |
| Create a Saved Tree | | | | | |
| Edit a Saved Tree | | | | | |
| Delete a Saved Tree | | | | | |
## Drivers
Drivers are metrics that directly influence or feed into another metric. By defining drivers in your `.yml` files, you can automatically visualize how metrics relate to each other in the Canvas view — no manual drawing needed.
For example, `total_order_amount` is a driver of `total_revenue`, `average_order_size`, and `total_completed_order_amount` — because each of those metrics is influenced by the total order amount. On the canvas, this creates a tree where `total_order_amount` fans out to the metrics it drives.
### Defining drivers
Add a `drivers` property to any metric listing the metrics that flow into it. You can reference metrics from the same table or across tables using the `table.metric` syntax:
```yaml theme={null}
models:
- name: orders
columns:
- name: order_amount
meta:
metrics:
total_revenue:
type: sum
drivers:
- total_order_amount
average_order_size:
type: average
drivers:
- total_order_amount
total_completed_order_amount:
type: sum
drivers:
- total_order_amount
```
```yaml theme={null}
models:
- name: orders
columns:
- name: order_amount
config:
meta:
metrics:
total_revenue:
type: sum
drivers:
- total_order_amount
average_order_size:
type: average
drivers:
- total_order_amount
total_completed_order_amount:
type: sum
drivers:
- total_order_amount
```
```yaml theme={null}
type: model
name: orders
dimensions:
- name: order_amount
metrics:
total_revenue:
type: sum
sql: ${TABLE}.order_amount
drivers:
- total_order_amount
average_order_size:
type: average
sql: ${TABLE}.order_amount
drivers:
- total_order_amount
total_completed_order_amount:
type: sum
sql: ${TABLE}.order_amount
drivers:
- total_order_amount
```
This creates edges on the canvas pointing from each driver to the current metric (e.g., `total_order_amount` → `total_revenue`, `total_order_amount` → `average_order_size`, etc.).
### How drivers appear on the canvas
* **Automatic**: Driver edges appear as soon as both the driver and target metrics are on the canvas.
* **Read-only**: You cannot delete or modify driver edges from the UI — they are managed through your `.yml` configuration.
In Saved Trees, driver edges are displayed alongside manually-created edges, giving you a complete picture of both the relationships you've drawn and the ones defined in your data model.
Driver edges cannot be removed from a Saved Tree. If you don't want a driver edge to appear, remove one of its endpoint nodes from the canvas.
1. In the Canvas View, click **New Tree** to enter edit mode.
2. Type a name in the text input at the top of the canvas.
3. Drag metrics from the sidebar into the canvas and draw connections between them.
4. Click **Save**. The button is disabled until you provide a name and add at least one node.
When you save, the tree name, node positions, edges, and metric references are all persisted.
Click **Cancel** to discard your work. If you have unsaved changes, a confirmation dialog will appear.
[Driver edges](#drivers) are not stored with the tree — they are injected automatically whenever matching nodes are present.
### Collaborative locking
Only one user can edit a Saved Tree at a time. When you start editing, the tree is locked to you. The lock stays active while you work — if you stop editing for more than 2 minutes, the lock is automatically released so others can make changes.
When a tree is locked by another user, you'll see an **"Editing by "** badge in the header, and the Edit and Delete options are disabled until the lock is released.
Your changes are automatically saved as a draft while you edit, so if you accidentally close the tab or refresh the page, your work-in-progress can be recovered when you return.
### Permissions
| Action | Admin | Developer | Editor | Interactive Viewer | Viewer |
| :------------------ | :-------------------------------------------: | :-------------------------------------------: | :-------------------------------------------: | :-------------------------------------------: | :-------------------------------------------: |
| View a Saved Tree | | | | | |
| Create a Saved Tree | | | | | |
| Edit a Saved Tree | | | | | |
| Delete a Saved Tree | | | | | |
## Drivers
Drivers are metrics that directly influence or feed into another metric. By defining drivers in your `.yml` files, you can automatically visualize how metrics relate to each other in the Canvas view — no manual drawing needed.
For example, `total_order_amount` is a driver of `total_revenue`, `average_order_size`, and `total_completed_order_amount` — because each of those metrics is influenced by the total order amount. On the canvas, this creates a tree where `total_order_amount` fans out to the metrics it drives.
### Defining drivers
Add a `drivers` property to any metric listing the metrics that flow into it. You can reference metrics from the same table or across tables using the `table.metric` syntax:
```yaml theme={null}
models:
- name: orders
columns:
- name: order_amount
meta:
metrics:
total_revenue:
type: sum
drivers:
- total_order_amount
average_order_size:
type: average
drivers:
- total_order_amount
total_completed_order_amount:
type: sum
drivers:
- total_order_amount
```
```yaml theme={null}
models:
- name: orders
columns:
- name: order_amount
config:
meta:
metrics:
total_revenue:
type: sum
drivers:
- total_order_amount
average_order_size:
type: average
drivers:
- total_order_amount
total_completed_order_amount:
type: sum
drivers:
- total_order_amount
```
```yaml theme={null}
type: model
name: orders
dimensions:
- name: order_amount
metrics:
total_revenue:
type: sum
sql: ${TABLE}.order_amount
drivers:
- total_order_amount
average_order_size:
type: average
sql: ${TABLE}.order_amount
drivers:
- total_order_amount
total_completed_order_amount:
type: sum
sql: ${TABLE}.order_amount
drivers:
- total_order_amount
```
This creates edges on the canvas pointing from each driver to the current metric (e.g., `total_order_amount` → `total_revenue`, `total_order_amount` → `average_order_size`, etc.).
### How drivers appear on the canvas
* **Automatic**: Driver edges appear as soon as both the driver and target metrics are on the canvas.
* **Read-only**: You cannot delete or modify driver edges from the UI — they are managed through your `.yml` configuration.
In Saved Trees, driver edges are displayed alongside manually-created edges, giving you a complete picture of both the relationships you've drawn and the ones defined in your data model.
Driver edges cannot be removed from a Saved Tree. If you don't want a driver edge to appear, remove one of its endpoint nodes from the canvas.